By the Numbers: Illegal Marijuana in Colorado

Is Colorado’s marijuana black market growing? Experts say it is difficult to truly measure something that is happening underground, but most of the existing measures from law enforcement point to a black market that has not decreased since the recreational use and purchase of cannabis was legalized in 2014.
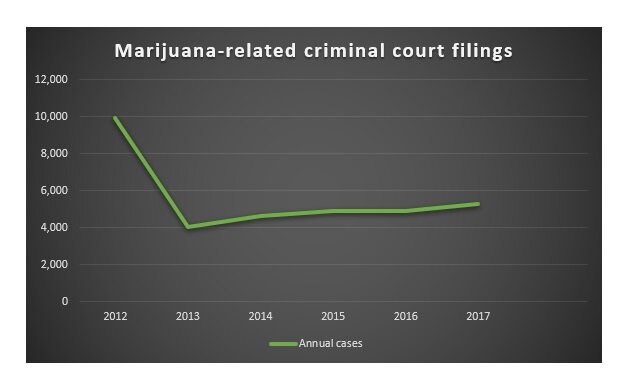
Overall, marijuana-related prosecutions decreased significantly from 2012 to 2017 – with the number of cases growing slightly every year since legalization. This is according to a recent analysis by the Colorado Department of Public Safety aimed at studying the effects of marijuana legalization in the state.
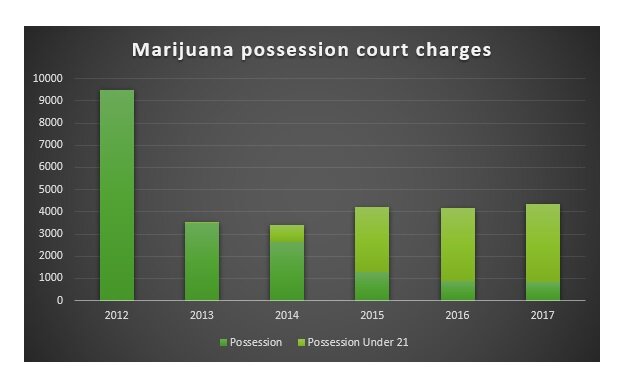
This drop in prosecutions includes a 54% decrease in possession cases from 2012 to 2017.
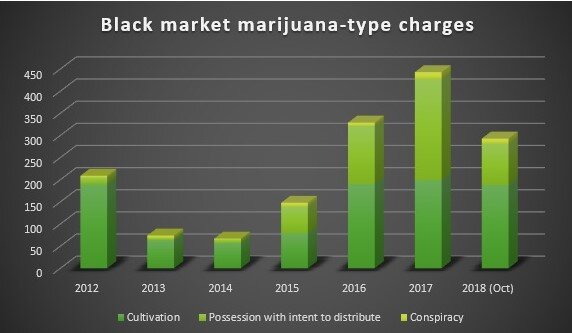
But at the same time the number of serious felony charges indicating black market activity have increased.
Rocky Mountain PBS analyzed state data of cases including charges of cultivation of 30 or more plants and/or possession with the intent to distribute more than 50 pounds of marijuana and/or conspiracies involving more than 50 pounds of marijuana, going back to 2012. (The 2018 numbers are through October 30.)
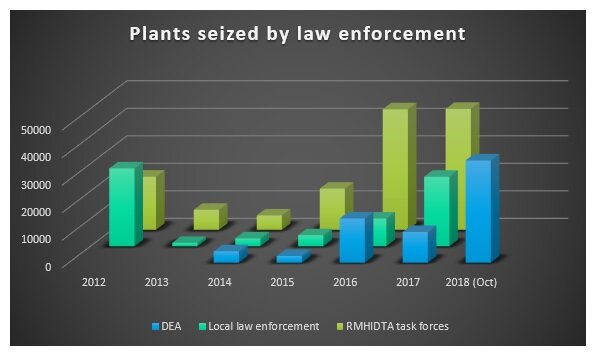
Figures from task forces from the Rocky Mountain High Intensity Drug Trafficking Area and the DEA indicate more marijuana plants are being seized, indicating illegal activity, since legalization took effect.
There are a number of caveats to consider with the above chart tracking plant seizures. First, the DEA could only provide numbers from 2014 to 2018 (through October) and the agency provided plant seizure numbers in ranges. The numbers represented in this chart are at the low end of the range, so this chart may not fully reflect all of the plants that were seized.
Secondly, the local law enforcement data was analyzed by the state department of public safety based on numbers reported to the CBI. Authorities tell us agencies have generally not been legally required to report those figures to the CBI so they too may not be fully comprehensive.
Third, because the numbers of seizures were reported by the state and RMHIDTA in aggregate, rather than pointing to specific seizure locations, it is not known if there is any overlap between these three sets of plant seizure data.
But detailed data provided by the DEA shows it has searched more locations where marijuana was seized this year than it did in 2014:
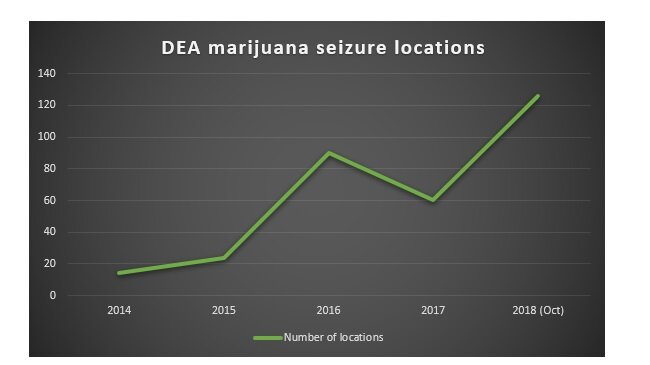
The RMPBS Insight team obtained addresses where search warrants have been served and marijuana has been seized by the DEA between 2014 and October of 2018. The DEA did not provide the precise addresses but instead the 100-blocks of these search warrant locations. RMPBS also obtained search warrant data from the drug task forces of the Rocky Mountain High Intensity Drug Trafficking Area, and plotted the addresses provided by both entities on this interactive map:
So do all of these numbers add up to a growing black market? Sam Kamin, a professor of marijuana law and policy at the University of Denver, says it is difficult to know because it is an underground market that can’t be tracked until law enforcement finds it and decides to intervene.
“We still don't know whether the decision to prosecute those big cases now means that there are more of those big cases or that's a new emphasis of law enforcement,” Kamin said.
He said the black market is the most difficult aspect of the impact of marijuana legalization to quantify.
“You know what you have in revenue, you know what you have in sales. You can do pretty good surveys in terms of whether youth or adults are using marijuana more often, but the black market is a lot harder than most of those to measure,” Kamin said. “It’s an illegal market.”

